
Eight Animal Proteins, Ranked by Their Carbon Footprints

Protein provides necessary amino acids that keep our bodies functioning. The foods that are classified as proteins vary in other nutritional elements—such as fat content, calories, and micronutrients—as well as their impact on the planet. In fact, the highest- and lowest-carbon animal proteins on our list differ by 45.68kg of carbon dioxide equivalent (CO2e), which is a measurement used for greenhouse gas emissions. To put that amount into perspective, about 45kg of CO2e equals the emissions of 115 miles driven by a gasoline-powered car.
Here, we’ll dive into the animal proteins with the largest carbon footprints, starting from largest to smallest. We will cover why each has such a significant impact and where plant protein fits into the conversation.
8 Highest-Carbon Animal Proteins
The amounts of CO2e per 100g of protein are confirmed by a Science study processed by Our World in Data.
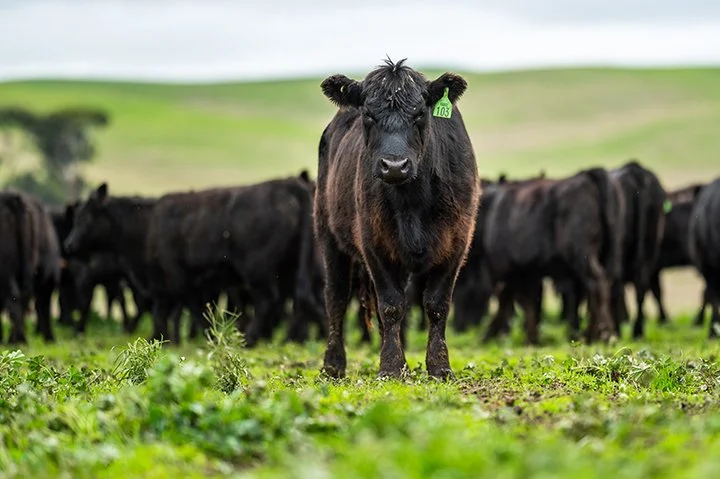
Beef
49.89kg of CO2e per 100g of protein
Why does beef have the highest carbon footprint by such a wide margin? While there are many factors contributing to beef’s impact, cows’ digestive systems are among the most significant.
Classified as ruminants, cows digest the grass they eat through not one, not two, but four stomachs. While their digestive process, known as enteric fermentation, allows them to sufficiently digest their foods, it also produces lots of methane. Just one cow is capable of producing 500 liters of methane per day.
In addition to methane production, the land use required to raise cows is larger than for any other animal protein, and deforestation is a major contributor to our overall greenhouse gas emissions. Manure overload on overcrowded factory farms also contributes, causing phosphorus- and nitrogen-heavy water pollution.
It’s worth noting that beef cows (49.89kg of CO2e) have higher emissions than dairy cows (16.87kg of C02e). A dairy cow’s emissions are spread between two products, milk and meat, which makes raising dairy cows at least slightly more sustainable compared to beef-only cows.
Lamb & Mutton
19.85kg of CO2e per 100g of protein
Like cows, sheep and lambs are ruminant animals, so their digestive processes also produce a large amount of methane. But you may have noticed beef’s CO2e per 100g of protein is more than double that of lamb and mutton. According to Carbon Brief, sheep don’t take as long to grow and reproduce, so they require less feed, water, and land than cows do.
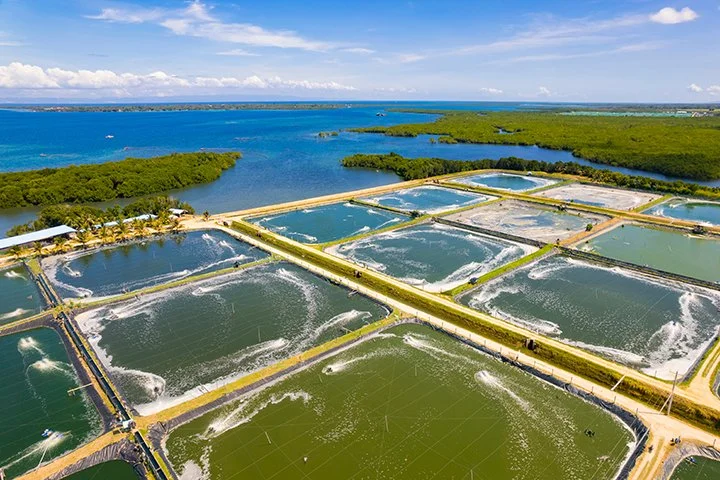
Farmed Prawns
18.19kg of CO2e per 100g of protein
After beef and lamb, it may be surprising to see seafood so high on the list. But farmed prawns, as well as farmed shrimp, are largely responsible for the destruction of mangrove forests, a collection of trees and shrubs growing in coastal saltwaters. Along with serving as important ecosystems for aquatic organisms, mangroves sequester carbon, which helps to decrease CO2 in the atmosphere.
When mangrove forests are cleared for prawn farming, all of the trapped carbon is released back into the air, wrecking environmental havoc.
In addition to mangrove destruction, the carbon footprint of farmed prawns and farmed shrimp also comes from sourcing soy to feed the crustaceans. Wild-caught prawns have a lower footprint but still rely on the use of boat fuel and other resources.
Cheese
10.82kg of CO2e per 100g of protein
Higher in carbon than any other meat or fish below is cheese, which has almost double the CO2e per 100g of protein of poultry. This makes sense when you understand that cheese comes from cows, goats, and sheep that still require land use, feed, water, manure management, and other farm processes that create emissions.
Cheese type also plays a role in exact emissions. According to the Cambridge Carbon Footprint, hard cheeses usually have a heavier carbon footprint than soft cheese due to the greater milk requirement and longer aging and cooking times.
Pork
7.61kg of CO2e per 100g of protein
The emission sources of pork are similar to those of other animals, including water, feed, and land usage. While pigs are not ruminants like cows and sheep, they still release carbon back into the air during and after digestion.
Improved manure management could make a substantial difference in lower emissions on pig farms, according to the CLEAR Center at UC Davis, noting that uncovered manure turns carbon into methane.

Farmed Fish
5.98kg of CO2e per 100g of protein
While wild-caught seafood contributes GHG emissions through fishing vessel fuel usage and refrigeration to keep fish fresh, these emissions pale in comparison to those raised in aquaculture operations. Farmed fish in these systems require food that must be grown, harvested, processed, and shipped.
Some fish species have a higher carbon footprint than others, in part due to their size. Sardines and anchovies, for example, have a lighter footprint than larger fish.
Poultry
5.7kg of CO2e per 100g of protein
The lowest meat category on our list, poultry’s top emissions sources are land use and feed cultivation. Chickens are monogastrics, meaning they have single-chamber stomachs and eat non-grass foods in order to survive. As a result, feed (maize, soybean, and wheat) is a massive investment on farms—particularly factory farms, which can hold hundreds of thousands of chickens at a time.
Other emission sources include manure management, farm fuel and electricity, processing, transportation and storage, and packaging.
Eggs
4.21kg of CO2e per 100g of protein
Eggs have the same emission sources as chickens do, but to a slightly smaller extent. According to a study in Poultry Science, reducing egg emissions could involve changing the “intensive systems highly dependent on imported cereals and soy.” Analyzing the efficiency of feed distribution on farms, as well as decreasing land-use change and degradation by investing in alternative feeds, can make a sizable difference in emissions.
Along with carbon emissions, sustainable consumers can learn about egg carton labels and what they tell us about the living conditions of egg-laying hens. For example, “cage-free” does not mean “free range”—that is, cage-free hens are likely still kept indoors in tight, crowded spaces. Even the free-range label does not promise that hens have sufficient space outdoors. You can learn more about egg labels and the most sustainable options on the Certified Humane website.
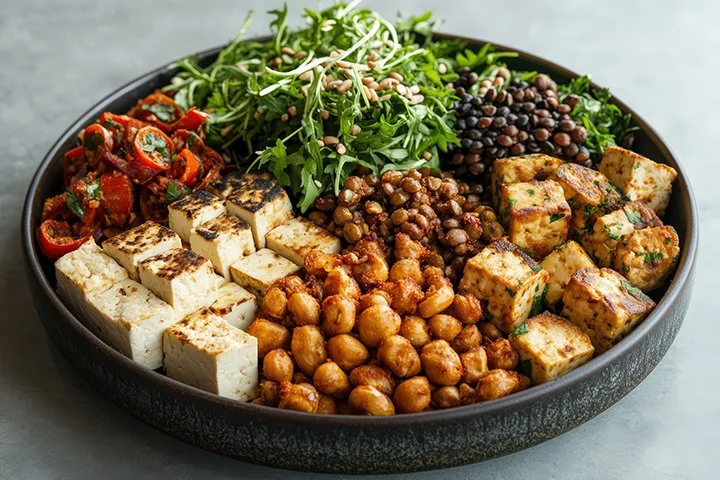
Animal vs. Plant Proteins
The difference in environmental impact between animal and plant proteins is tremendous. The BBC reports that animal products are responsible for 57% of global food-related emissions, while plant-based foods are responsible for 29%. Indeed, the lowest emission diet is entirely plant-based and without meat or dairy.
Plant proteins, in particular, are lower due to requiring much less resources—land, water, no feed—than animal proteins. That said, they are not without at least small carbon footprints. Grains typically emit 2.70kg of CO2e per 100 grams of protein, while tofu produces nearly 2kg due to the clearance of land for soy production. Peas and nuts come in at under 1 kg each, producing .44 and .26kg of CO2e respectively.
You don’t need to adopt a super strict plant-based diet to lower your food-based carbon footprint. Being aware of the resources required to produce the proteins you eat can help you make informed choices in the grocery store.